

When the money arrived, there was no company to allocate the money to. And all of these are normal in Canada.
The First Architect
Five men whose careers spanned the full spectrum of mining pooled half a million Canadian dollars. They had no idea that what they were creating would one day try to break China’s grip on the rare earths industry. Not even when the initial investors paid an additional 250000 dollars did they know what these men would do.
When the money arrived, there was no company to allocate the money to. And all of these are normal in Canada.
Capital Pool Company (CPC)
Is a shell to raise money from the public in an IPO without the existence of a real company.
That’s exactly what Birchpoint was: a company allowed to go public with nothing but cash and a management team (five men), on the promise of finding a real business to buy within a 24-month window.
The acquisition that turns the shell into an operating company is the Qualifying Transaction. Seven months after the IPO, Birchpoint bought Hot Rock Uranium, after which it stopped being a CPC and became Ucore Uranium Inc. Hot Rock was a uranium exploration company.
The idea is strange to anyone who comes from venture capital, because the sequence is inverted. Normally, capital chases a business. Here, the capital was raised first, and the business was chosen afterward, from whatever turned up.
Who Cares?
Investors in 2026, especially venture capital firms and strategic investment offices of the Pentagon and the US intelligence services. Their investment thesis is to find frontier technologies critical to the USA’s arms force and intelligence superiority that are commercially viable. They fund specific projects to achieve a specific goal. As you can see further, Ucore’s goal is survival regardless of the business.
The Moat
Their competitive advantage is obvious. The architecture of the company allows it to survive. From 2005 to the end of 2006, they had no plan besides finding a company, no technology, no IP, no business model, no tangible assets besides cash, which was tied to a shell company. But the money went vertical, from $500k to $11 million without drilling the ground.
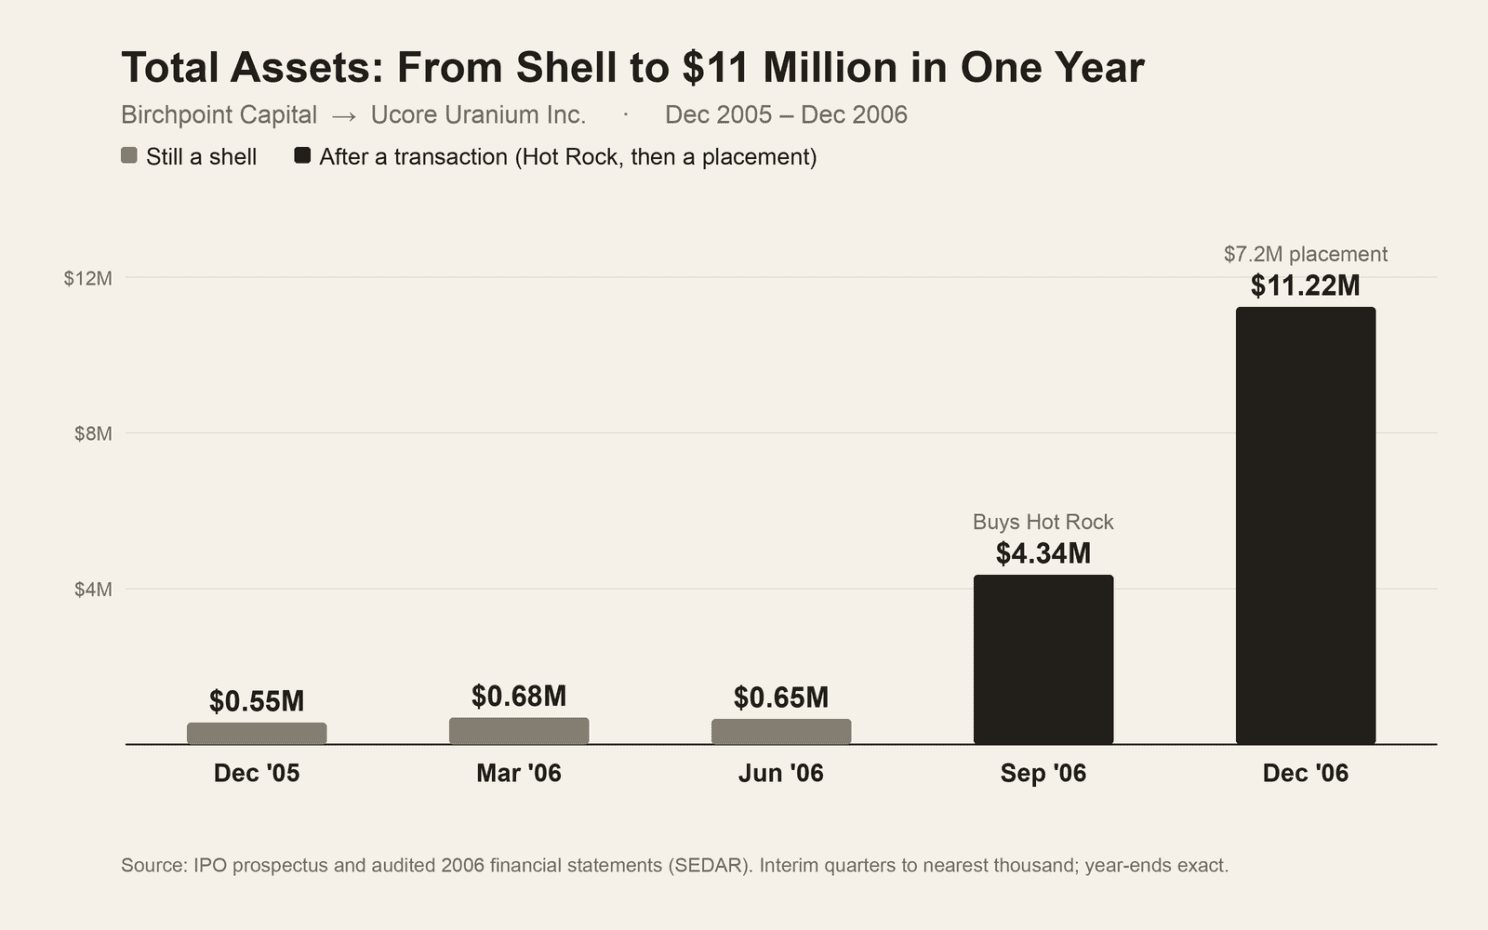
Asset Accumulation from December 2005 to December 2006
But how did they do it?
The Money Machine
Birchpoint went public on the TSX Venture Exchange, issuing 2,500,000 shares at $0.10 each to public investors. Cash Added: +$250,000 gross.
Note: figures are shown post-split (two-for-one, October 2006), in reality the public bought 1,250,000 shares at $0.20.
Instead of using cash to buy Hot Rock, Ucore printed 12,800,000 shares and exchanged them for Hot Rock’s owners. Assets Added: +$2,679,438 in paper value (mostly mineral properties).
Right alongside the merger, they sold 6,640,000 shares at $0.135 per share to private investors to ensure the newly combined company had immediate money to operate. Cash Added: +$896,400 gross.
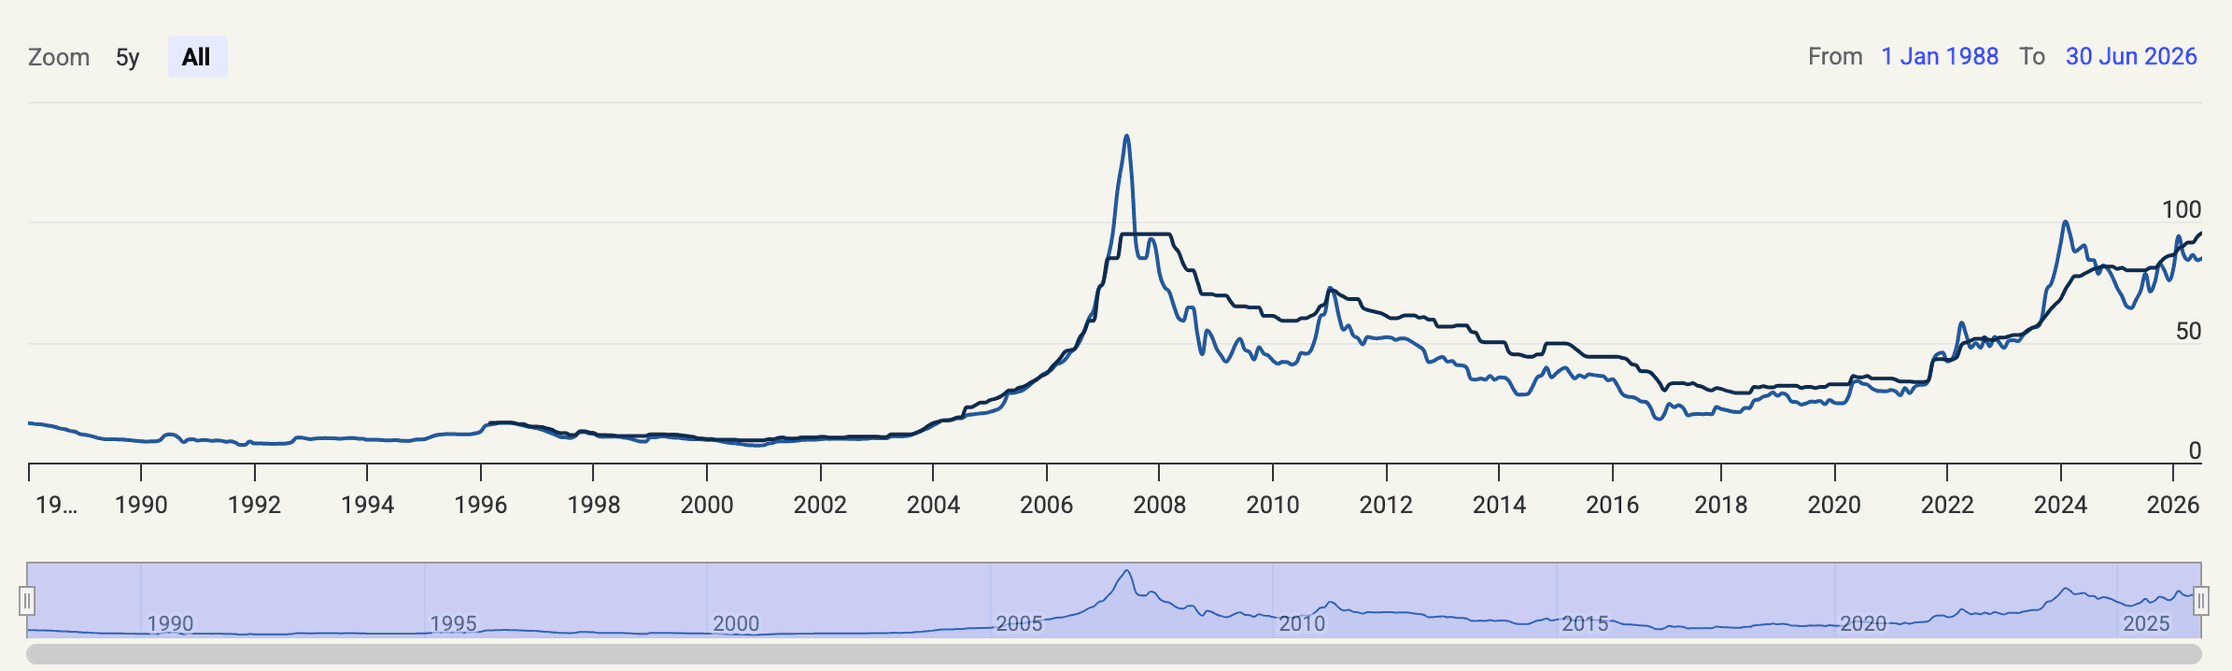
Uranium Price Chart All Time. Source: https://www.cameco.com/invest/markets/uranium-price
With uranium market sentiment booming in late 2006, Ucore pulled off a massive private placement. They issued 8,580,000 shares split between regular units (at $0.76) and flow-through shares (at a premium of $0.95). Cash Added: +$7,201,000 gross.
A Profitable Business
Today, after 20 years, they have never made a profit. The chart below shows the net loss year on year from 2006 to the end of 2025. Mining is a profitable business, it just takes several years, but Ucore began as an exploration company and never stayed there.
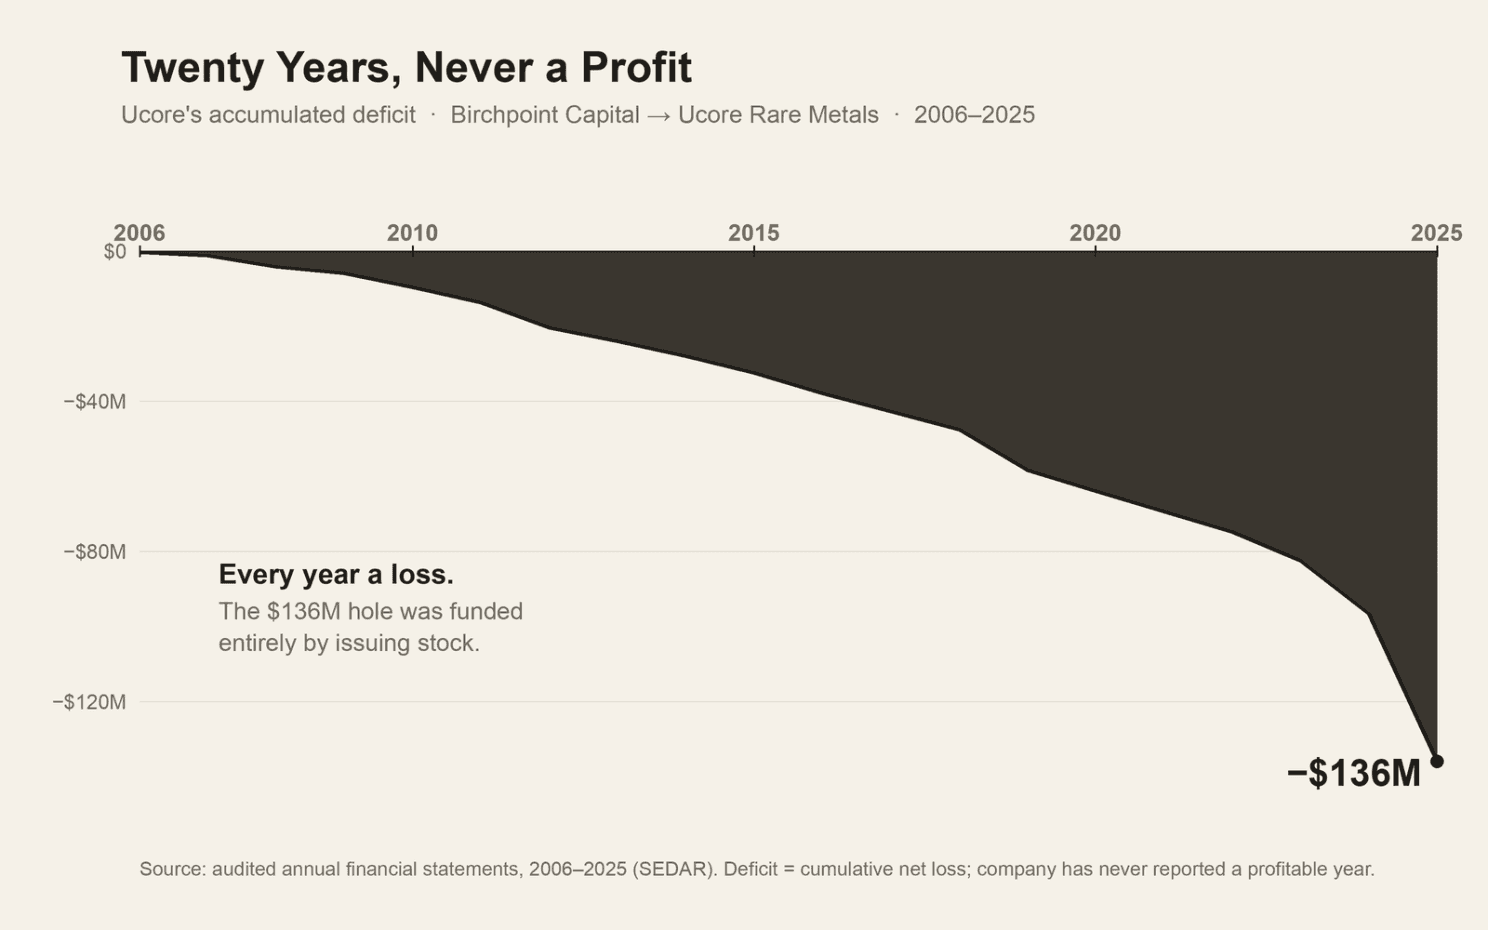
Net Accumulated Loss from 2006 to 2025
The value creation described above (The Money Machine) is a repeating pattern in Ucore’s financial strategy.
Acquisition of hard assets, capitalizing on market sentiment, joint ventures, or swallow of technology companies relevant to the day, allows them to reassure investors they are on a right path. They were never profitable in the first 5 years, but the books show almost three-fold asset accumulation in the same period up to $31 million.
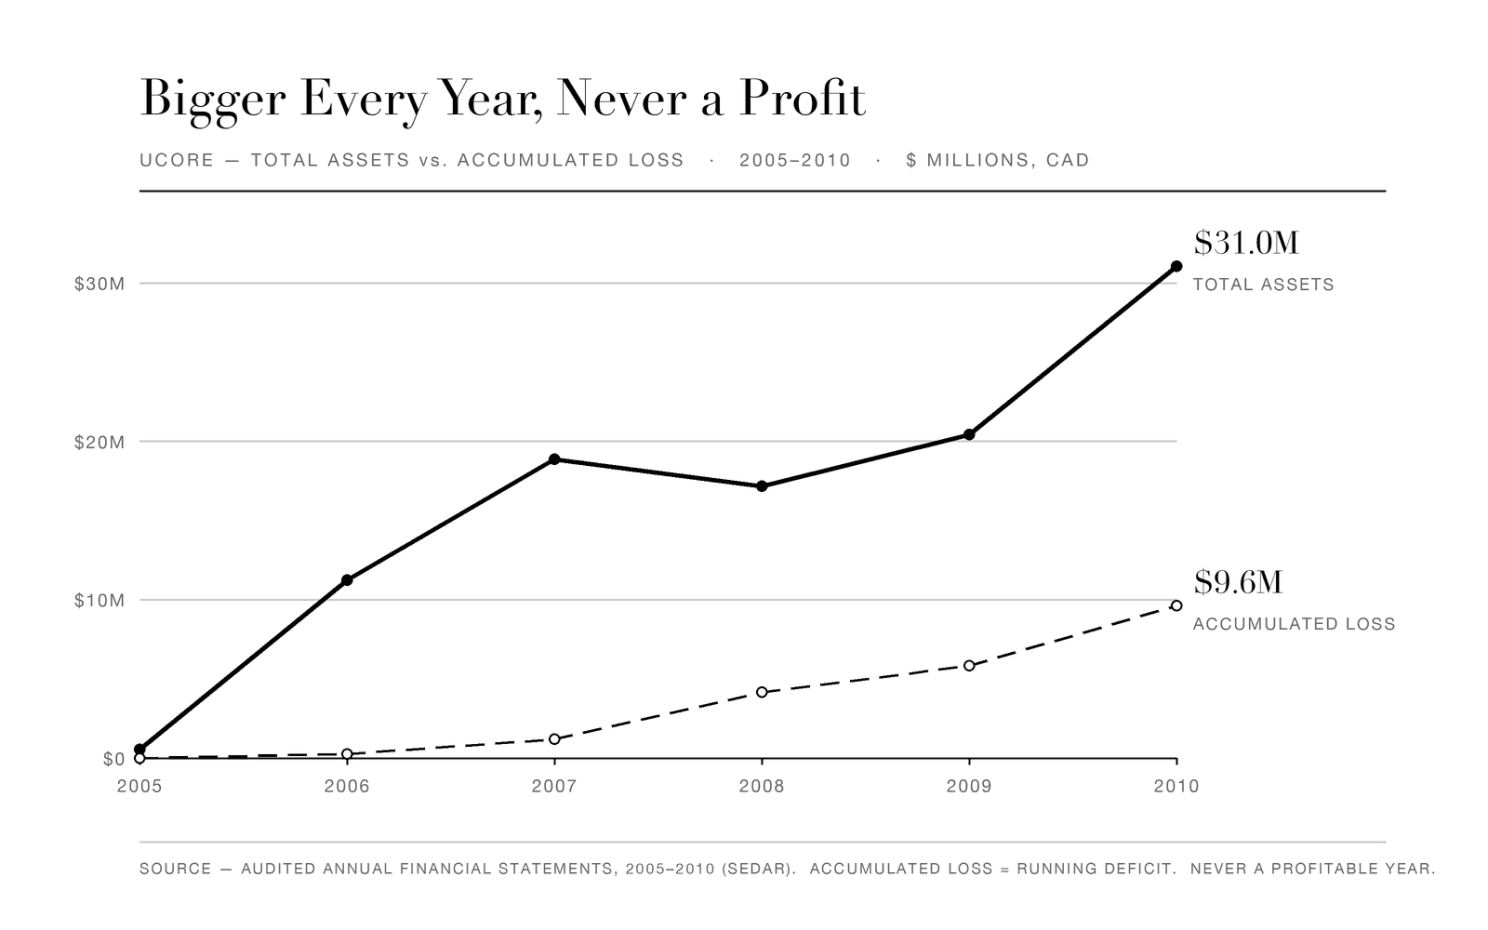
Accumulated Asset vs Accumulated Loss from 2005 to 2010
But was the asset really worth 31 million dollars?
The $31 million wasn’t the value of an asset, but it was the value of Ucore’s own shares. Only about $11.6 million of it was cash, and even that was raised by selling stock, not earned.
The other ~$19 million sat in “resource properties,” booked not at what the ground cost but at the price of the paper used to buy it. The tax authority only ever recognized the cash spent.
There is a real deposit under all of their assets. They took their first stake in Bokan Mountain in 2007, through a joint venture with Landmark Minerals, and reached 100% by buying Landmark outright in a share-for-share deal while cash from the placements paid for the exploration and the option payments on the ground.
But “a deposit exists” and “the asset is worth $31 million” are different claims, and the latter was never a price anyone would pay in cash; it was an accounting figure that rose and fell with sentiment. Which is the point: the balance sheet grew nearly threefold in five years while the company never earned a dollar.
But was the Bokan asset worth it?
Six parts, fifteen years of filings, eighty-one promises.
This is what an investigation looks like before you invest. I run the same method privately on the company you are considering.
References
Birchpoint Capital Inc. (2005). Preliminary prospectus: Initial public offering. SEDAR. [R4]
Birchpoint Capital Inc. (2006a). Material change report: Closing of the qualifying transaction (dated October 2, 2006). SEDAR. [R7]
Birchpoint Capital Inc. (2006b). Prospectus: Initial public offering (final; dated January 23, 2006). SEDAR. [R3]
Gupta, C. K., & Krishnamurthy, N. (2005). Extractive metallurgy of rare earths. CRC Press. [R2]
SEDAR+. (2026). Filing history for Ucore Rare Metals Inc., 2005–2023 [Database search]. Retrieved July 17, 2026, from https://www.sedarplus.ca [R6]
TSX Venture Exchange. (2026). Policy 2.4: Capital pool companies (as at March 31, 2026). https://www.tsx.com/en/resource/2480 [R5]
Ucore Rare Metals Inc. (2011). Consolidated financial statements for the year ended December 31, 2010 (audited; KPMG LLP). SEDAR. [R15]
Ucore Uranium Inc. (2007a). Consolidated financial statements for the year ended December 31, 2006 (audited; KPMG LLP). SEDAR. [R9]
Ucore Uranium Inc. (2007b). Management’s discussion and analysis for the year ended December 31, 2006. SEDAR. [R8]
Ucore Uranium Inc. (2008). Consolidated financial statements for the year ended December 31, 2007 (audited; KPMG LLP). SEDAR. [R10]
Ucore Uranium Inc. (2009a). Consolidated financial statements for the year ended December 31, 2008 (audited; KPMG LLP). SEDAR. [R11]
Ucore Uranium Inc. (2009b). Management’s discussion and analysis for the year ended December 31, 2008. SEDAR. [R13]
Ucore Uranium Inc. (2010a). Consolidated financial statements for the year ended December 31, 2009 (audited; KPMG LLP). SEDAR. [R12]
Ucore Uranium Inc. (2010b). Management’s discussion and analysis for the year ended December 31, 2009. SEDAR. [R14]
Disclosure
I hold no position in Ucore Rare Metals or in any company mentioned here, and I have not been paid by any of them or by anyone with an interest in them. Nobody reviewed this article before publication.
This is not investment advice. It is an analysis of documents the company filed publicly, written for readers who want to understand how a technology and a business develop over time. It is not a recommendation to buy, sell, or hold any security, and it does not take account of anyone’s financial situation.
Every claim rests on a public source, named where it is used. The filings are on SEDAR+, the press releases are on the company’s website, and the contracts were filed as material documents. Where I could not verify something, I say so in the text.
If you find an error, write to me and I will correct it and say what changed.
Turn your phone sideways to read the charts. They are best on a desktop.
Published by House of Hōma OÜ, registered in Estonia.

